We will now configure Prometheus on the Prometheus machine so that it can scrape the metrics from cAdvisor. To do so, modify the /etc/prometheus/prometheus.yml file so that it includes the following within the server running Prometheus:
$ sudo vim /etc/prometheus/prometheus.yml
…
- job_name: ‘node_exporter’
scrape_interval: 5s static_configs:
- targets: [‘localhost:9100’, ‘<Docker_IP>:9100’]
- job_name: ‘Docker Containers’ static_configs:
- targets: [‘<Docker_IP>:8080’]
After changing this configuration, we need to restart the Prometheus service. Use the following command to do so:
$ sudo systemctl restart prometheus
Now, let’s launch a sample web application that we will monitor using Prometheus.
Launching a sample container application
Now, let’s run an NGINX container called web that runs on port 8081 on the Docker machine. To do so, use the following command:
$ docker run -d –name web -p 8081:80 nginx f9b613d6bdf3d6aee0cb3a08cb55c99a7c4821341b058d8757579b52cabbb0f5
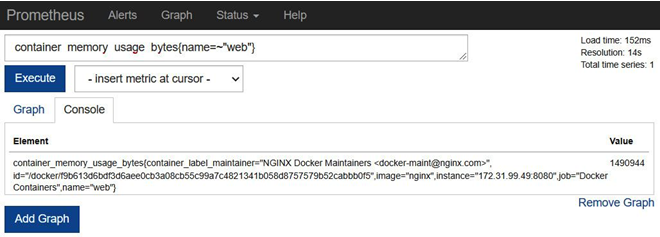
Now that we’ve set up the Docker container, let’s go ahead and open the Prometheus UI by visiting https://<PROMETHEUS_SERVER_EXTERNAL_IP>:9090 and then running the following query by typing it in the textbox:
container_memory_usage_bytes{name=~”web”}
It should show something like the following:

Figure 3.2 – Prometheus – container_memory_usage_bytes
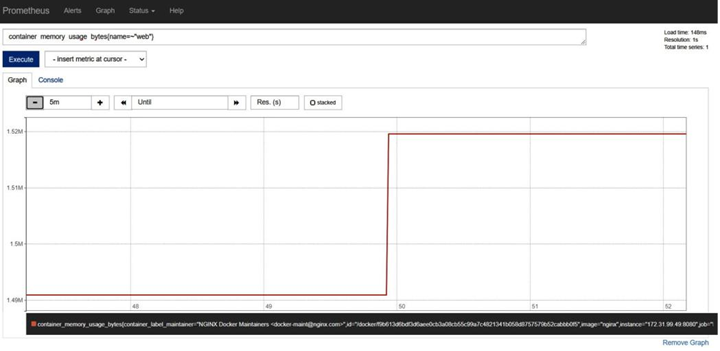
We can also view the time series of this metric by clicking on the Graph tab. However, before doing so, let’s load our NGINX service using the Apache Bench tool. Apache Bench is a load-testing tool that helps us fire HTTP requests to the NGINX endpoint using the command line.
On your Docker server, run the following command to start a load test:
$ ab -n 100000 http://localhost:8081/
It will hit the endpoint with 100,000 requests, which means it provides a fair amount of load to do a memory spike. Now, if you open the Graph tab, you should see something like the following:

Figure 3.3 – Prometheus – container_memory_usage_bytes – Graph
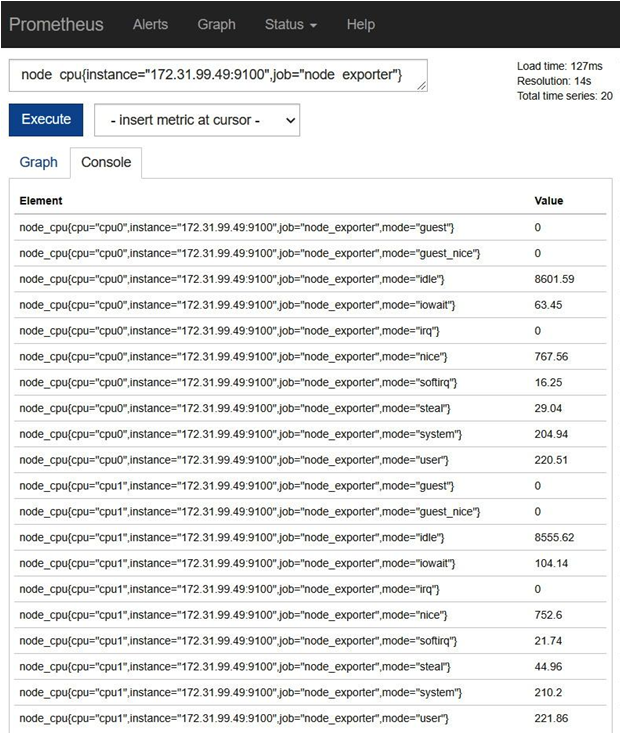
To visualize node metrics, we can use the following PromQL statement to get the node_cpu value of the Docker host:
node_cpu{instance=”<Docker_IP>:9100″,job=”node_exporter”}
As shown in the following screenshot, it will provide us with the node_cpu metrics for multiple modes:

Figure 3.4 – Prometheus – node_cpu
There are a variety of other metrics that Prometheus gives you to visualize. Let’s understand some of the metrics you can monitor.